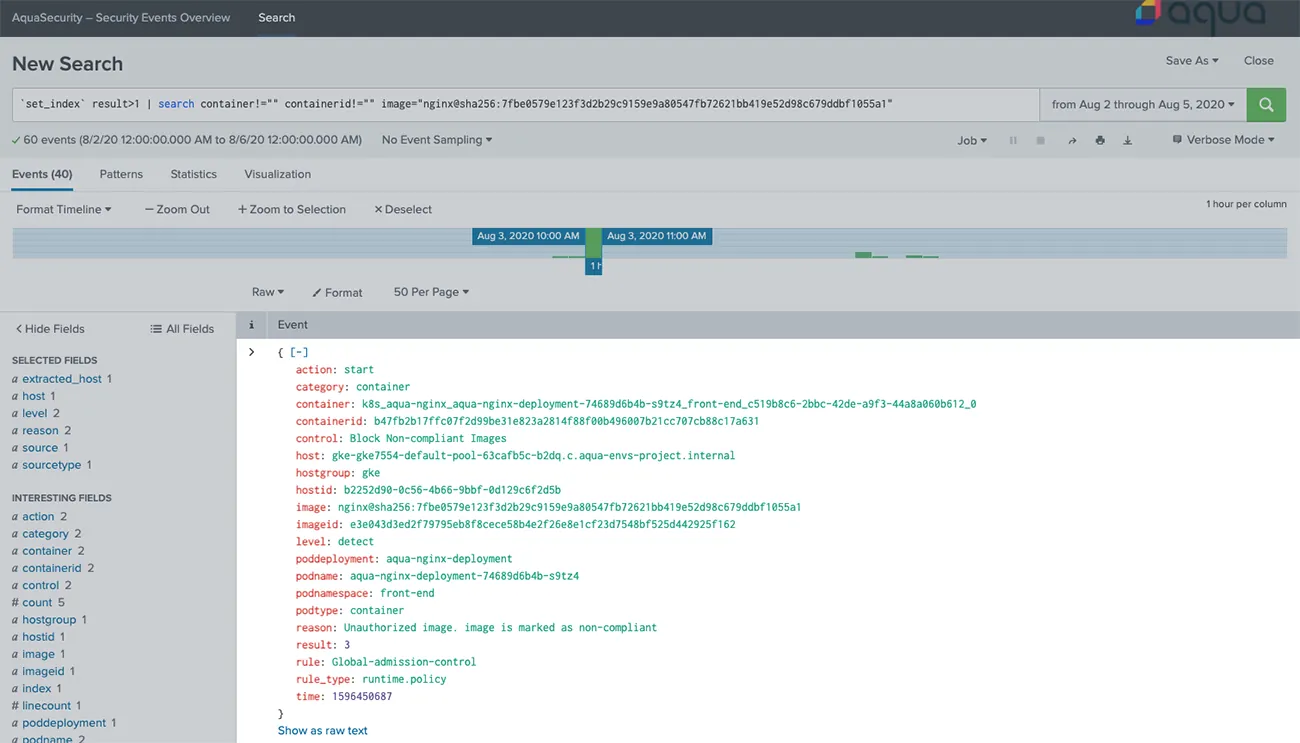
With no shortage of attacks targeting the cloud native stack, having a holistic view of your environment is paramount to contain and mitigate the attack, as well as to perform forensic analysis after the fact. In order to provide you with deeper insights into malicious and suspicious activity in your cloud native environment, we joined forces with Splunk to enhance our integration and present all security-related events detected by Aqua on your Splunk dashboard.
Detailed and robust visualizations help you identify and triage security events across your entire application stack, including images, infrastructure, and workloads.
Get data-driven security insights
As the attacks are getting more frequent and sophisticated, the ability to detect and investigate malicious activity in real time becomes critical. To enable this, you need to constantly collect information across your entire enterprise and aggregate all security-related events in one place. By gathering data from multiple disparate sources, analytical tools like SIEM help you gain a centralized view of your environment.
However, with cloud native environments, security teams face additional challenges posed by the complex microservices architecture and short-lived nature of the workloads. The average lifespan of a container is about several hours, while serverless functions are running for just 15 minutes. For tracking events across such ephemeral workloads dynamically deployed with Kubernetes, you need a holistic and deterministic tool that provides visibility specifically into a cloud native environment.
The enhanced Aqua’s integration with Splunk makes this security information not only accessible but also more usable for your SecOps teams – helping them prioritize alerts and making it easier to correlate events to determine suspicious behavior. The new dashboard displays a comprehensive view of your cloud native deployments while enabling you to:
- Monitor your environment in real time and respond to incidents quickly so that damage can be avoided or limited. By delivering the right alerts to the right teams, the dashboard helps you expedite troubleshooting, reduce the critical incident resolution time, and resolve issues as soon as they arise.
- Perform better contextual analysis. You can track security events and anomalies across your stack by category. Whether it’s a security event in the platform, container, network, or suspicious activity associated with a file, they all will be visible in the security events graph.
- View and analyze blocked events that indicate suspicious activity to reconstruct a full picture of the incident. The dashboard makes it easy to drill down into granular information quickly.

- Triage the problem faster and get access to more accurate forensics. The dashboard is designed to help you identify attacks and suspicious activity and then quickly triage the event down to the source. As Aqua’s detection and prevention are managed via policies, the tables below the graph show the most active security policies by policy name, host, and container, helping you determine what went wrong, where the incident happened, and which application was compromised.

- Get alerts of any security compliance violations that can make your environment more vulnerable. This can be, for example, servers that failed the security scanning and CIS benchmarks, images that failed the vulnerability scans, non-compliant images that are pushed to the cluster, malware in containers, and other threats.
Conclusion
To protect your cloud native environment, you need to continuously stay aware of what’s going on inside your workloads and clusters, collect and analyze security data, as well as prioritize your response efforts accordingly. By aggregating in one place all security events from across your entire application lifecycle, Aqua and Splunk offer a convenient and flexible tool to help you gain valuable security insights that are data-driven.

